
We catch failures before your team or the CEO notices.
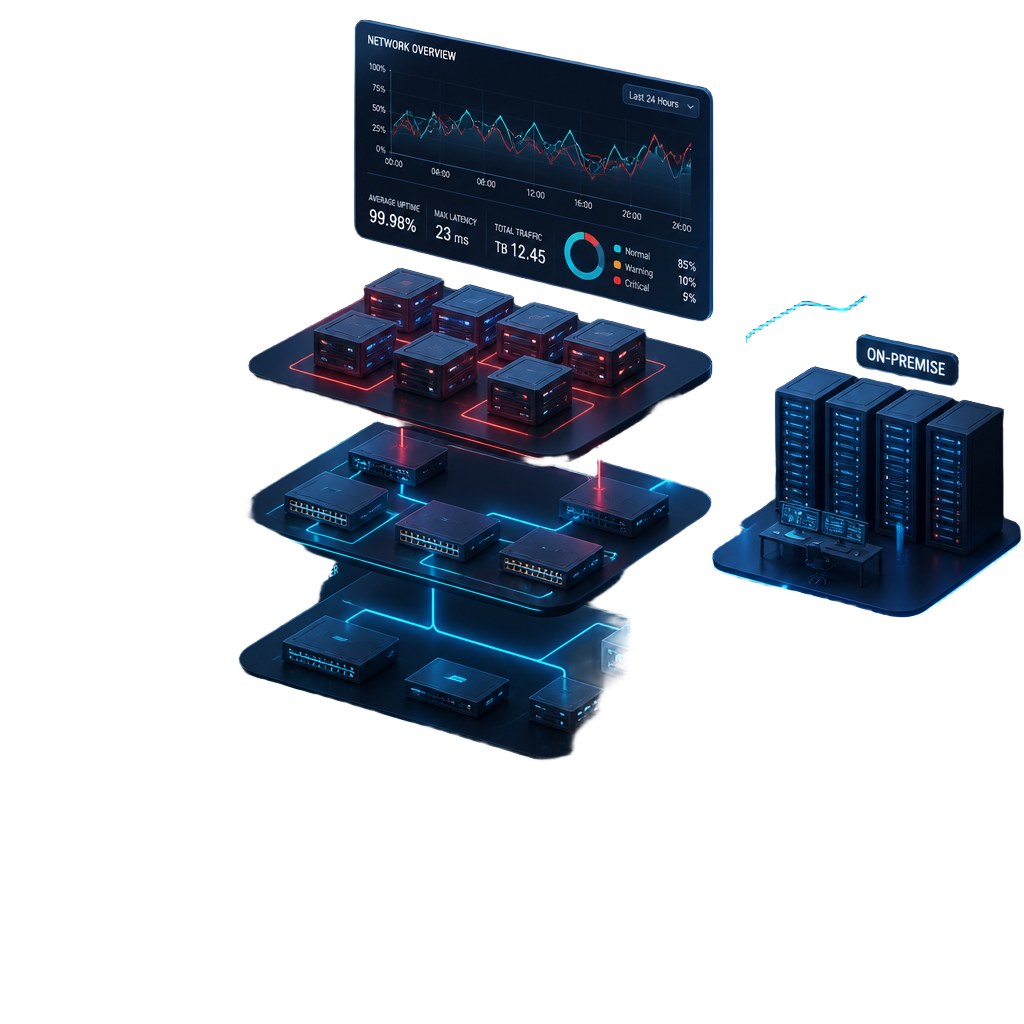
Stop reactive reports and flying blind. We deploy intelligent monitoring across your on-premise, hybrid and cloud infrastructure to resolve anomalies before they reach your users.
"The system is slow." The CEO call that ruins your morning.
Illustrative scenario: customers cannot invoice because a database disk exhausted its capacity and blocked the transaction pool before reactive support noticed. Operating blind increases detection time; the real impact depends on the environment.
Late detection and silent outages
You find out about network failures and server crashes only when end users open tickets or call to complain.
Monitoring scattered across 10 consoles
No consolidated dashboards. Your staff has to open separate consoles for network, servers, cloud and virtualization, slowing down diagnosis.
BITS Proactive NOC Model
Consolidation into a single screen. Unified monitoring and intelligent alerts configured to anticipate resource degradation.
Unified observability by defined scope
We integrate observability tools under a unified model managed by engineers, with coverage documented per service.
Server and VM monitoring
CPU usage, memory, storage, service logs and the physical health of Linux and Windows servers (on-premise and multi-cloud on AWS, Azure and Google Cloud).
Network and link observability
Detection of unusual latency, packet loss and VPN/SD-WAN tunnel drops. Native support for SNMP, ICMP and NetFlow streams.
APM and user experience
Synthetic monitoring and APM (Application Performance Monitoring) to measure SQL transactions and APIs against each application's defined SLOs.
Granular visibility across every infrastructure layer
An illustrative NOC console with four technical views and synthetic data demonstrating the capabilities.
CPU usage (last 24h)
App server vs database · hourly aggregate

How many silent outages happen in your IT every week?
Schedule a 30-minute scoping session to define access and collection methods. The diagnostic prioritizes observed risks and confirms the delivery schedule.
- Real vs reported uptime analysis
- Map of critical services with no coverage
- Prioritized observability quick wins
Watch a simulated NOC workflow
Trigger a synthetic anomaly and response scenario. Timings and outcomes illustrate the flow; they are not production telemetry or an SLA.
5 phases to deploy active observability
We agree the initial rollout window after discovery and mature the setup in phases, documenting planned changes and possible interruptions.
Asset inventory
Thorough mapping of critical servers, networks, applications and databases.
Agent deployment
Agile rollout of lightweight monitoring agents and SNMP configurations.
Role-based dashboards
Custom screen design: detailed technical metrics and executive KPIs.
Intelligent alerts
False-positive suppression and predictive resource-exhaustion configurations.
SLA reporting
Monthly review of uptime, performance and formal metric delivery.
Partners y tecnologías que dominamos








































Frequently asked questions about Monitoring
Empresas que confían su red en BITS
Migraciones reales a arquitecturas modernas de red y seguridad — con resultados medibles desde la primera fase.

Grupo Bafar
Servicios Administrados de red LAN/WAN y Seguridad Perimetral.
- Disponibilidad histórica documentada del 99.13%
- Optimización histórica de costos WAN

Paseo Central – Chihuahua
Integración tecnológica para un complejo comercial, hotelero y corporativo.
- CCTV Digital IP de Misión Crítica
- Control de Acceso Avanzado

Grupo México
Seguridad y automatización para ambientes mineros exigentes.
- Monitoreo Integral con IA
- Reducción de Costos en Operación
Aprende más sobre SASE y Zero Trust
Artículos seleccionados de nuestro blog para entender mejor la convergencia de red y seguridad en la nube.
Plan proactive monitoring for your infrastructure
We assess critical servers, links and applications, then propose a phased rollout, coverage and commercial terms for your operation.
NDA available · Rollout risk and production impact assessed before changes